Until now, we have been using diagrams to illustrate objects and classes
The diagrams for objects illustrate snapshots of the state of an object during program execution and are called object-diagrams.
The diagrams for illustrating classes is a way to illustrate the program text and thus the static structure of a program – these diagrams are called class-diagrams.
In this section, we introduce diagrams for showing snapshots that illustrate the dynamic structure of objects, method invocations and method activations during program execution. These diagrams include object diagrams and are called Object-Sequence Diagrams (OSD).
In addition to object diagrams, they illustrate method invocations.
Consider the program sketch below:
main: obj
   objA: obj
      msgA:
         ...
         objB.msgB
         ...
   objB: obj
      msgB:
         ...
         objC.msgC
         ...
      msgQ:
         L2: ...
   objC: obj
      msgC:
         L1: ...
         objB.msgQ
         ...
   objA.msgA
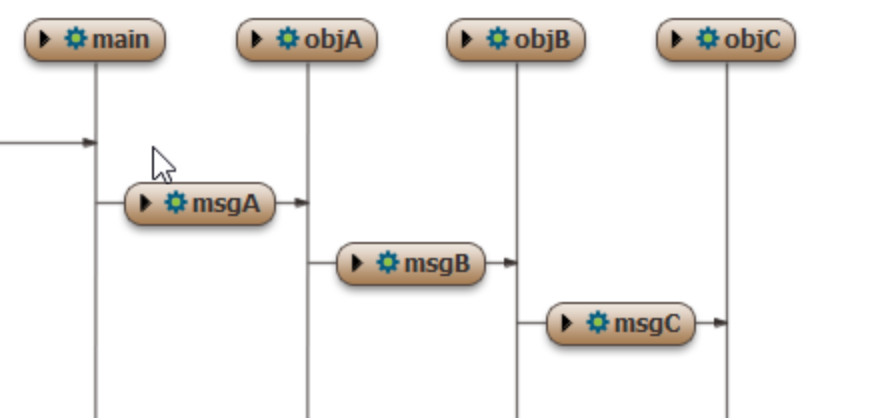
The main object invokes objA.msgA; objA invokes objB.msgB; objB invokes objC.msg3. The diagram below illustrates the situation during execution when msgC is at label L.

The columns have four objects, main, objA, objB and objC. The vertical lines from these objects are called lifelines and represents time as seen by the object.
A method invocation is shown as an arrow for the lifeline of the caller object to the lifeline of the receiver. The arrows are labeled by the method. The top arrow at the left-side to main illustrates that main is executed by some object in the environment.
The arrow for objA.msgA id above the arrow for objB.msgB, which is above the arrow for objC.msgC, illustrating order in time of these method invocations.
The next diagram illustrate the situation where objC has invoked objB.msgQ and msgQ is at the label L2:

As side the lifelines and arrows showing method invocations represents how actions are ordered in time. The ordering of the objects in the columns does not matter, but usually a diagram may be more readable if the ordering in time flows from left to right to the extend that this is possible.
